Input Data Infrastructure Analysis
Overview
This report presents a methodological framework for processing multispectral drone data from wheat plots and estimating nitrogen and water requirements using machine learning and LLM-based evaluation.
Data Preparation and Definition
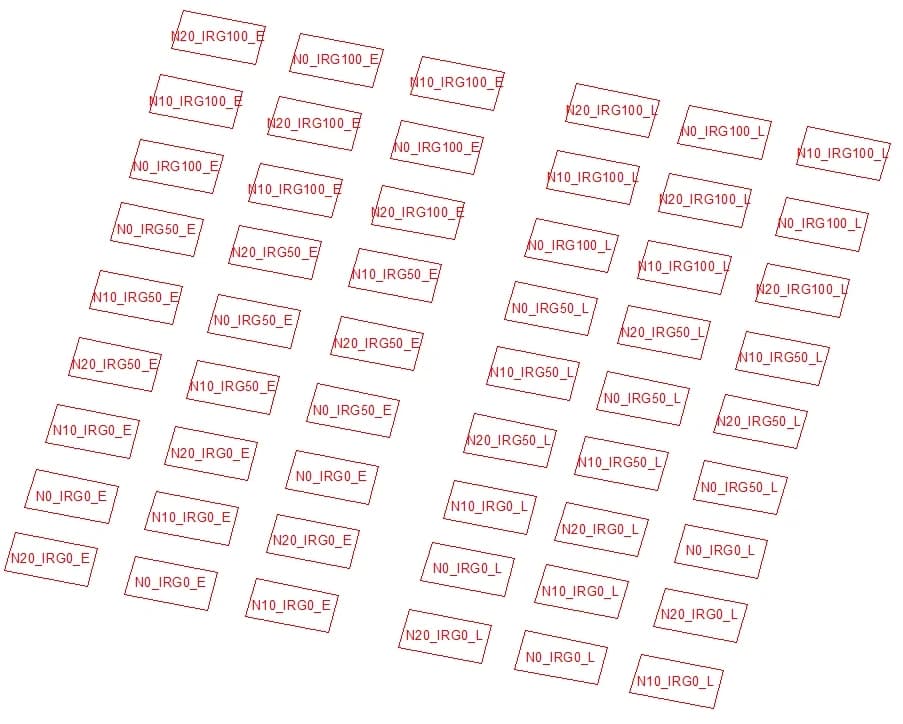
The dataset combines XML statistics derived from multispectral drone imagery with plot-based nitrogen and irrigation variables.
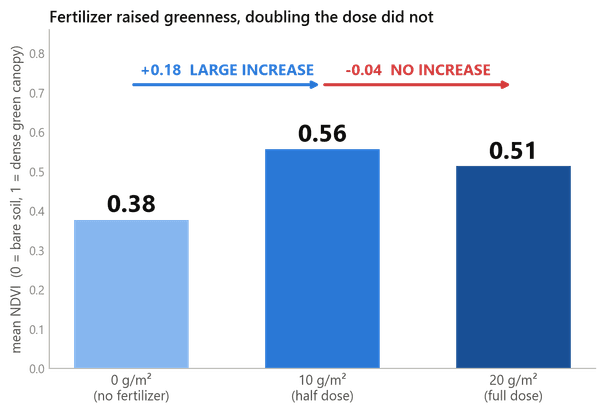
- Nitrogen classes: 0 g/m² (Low), 10 g/m² (Medium), 20 g/m² (Ideal).
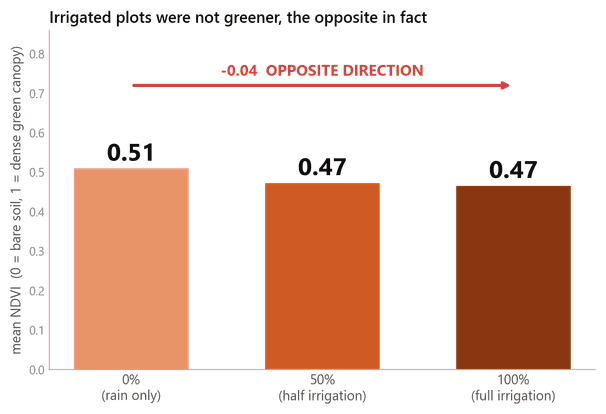
- Irrigation classes: 0% (Low), 50% (Medium), 100% (Ideal).
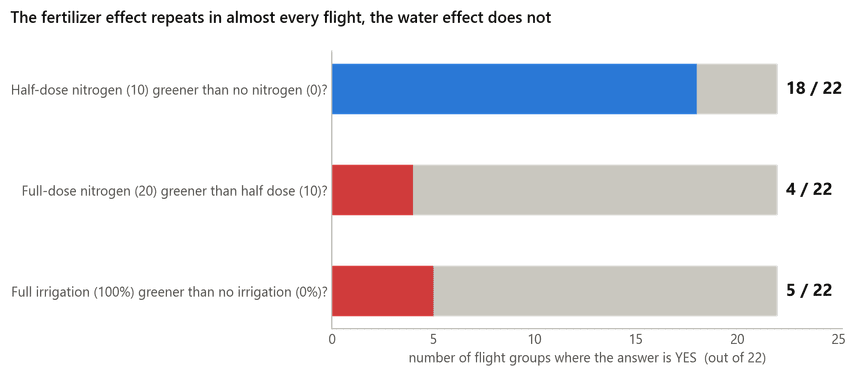
- Preliminary correlation insight: nitrogen has a stronger relationship with NDVI than irrigation.
Methodology and Data Processing
- Transform data from wide (date columns) to long/tidy (one row per measurement moment).
- Add DAS (Days After Sowing) to model biological age effects on NDVI dynamics.
- Normalize features with StandardScaler; encode categorical values with LabelEncoder.
- Add heterogeneity range (Max–Min) as a feature to capture within-plot variability, relevant for water stress.