Software I: Data Processing Model

NDVI data processing model.

Berlin, GermanyDecember 15, 2025 – October 31, 2026

First Data Collection

The 2025 season: how the input data was prepared, which model was chosen and how it was trained.

Input Data Infrastructure Analysis

Overview

This report presents a methodological framework for processing multispectral drone data from wheat plots and estimating nitrogen and water requirements using machine learning and LLM-based evaluation.

Data Preparation and Definition

The dataset combines XML statistics derived from multispectral drone imagery with plot-based nitrogen and irrigation variables.

  • Nitrogen classes: 0 g/m² (Low), 10 g/m² (Medium), 20 g/m² (Ideal).
  • Irrigation classes: 0% (Low), 50% (Medium), 100% (Ideal).
  • Preliminary correlation insight: nitrogen has a stronger relationship with NDVI than irrigation.

Methodology and Data Processing

  • Transform data from wide (date columns) to long/tidy (one row per measurement moment).
  • Add DAS (Days After Sowing) to model biological age effects on NDVI dynamics.
  • Normalize features with StandardScaler; encode categorical values with LabelEncoder.
  • Add heterogeneity range (Max–Min) as a feature to capture within-plot variability, relevant for water stress.
Model Selection

Machine Learning vs Large Language Models

  • ML: low compute cost, deterministic reliability, requires domain expertise for feature engineering (DAS, scaling).
  • LLM: high compute/API cost, can capture logical relationships but has hallucination risk.
  • Few-shot setup: provide 215 real training samples and ask for 55 test predictions.

Analysis Results

Nitrogen prediction

Highlights

Gemini 3 (LLM) reached 72.73% accuracy; Naive Bayes led ML with 65.50%.

Water stress (irrigation) prediction

Highlights

Gemini 3 and DeepSeek-V3 reached 54.55%; Decision Tree led ML with 49.10%.

Full comparison

The embedded results-table figure contains the complete set of evaluated models and accuracies.

General Evaluation and Roadmap

  • Key learning: expert-driven processing (especially DAS) is critical.
  • Decision: adopt Naive Bayes for nitrogen (cost-effective and stable among ML).
  • Decision: adopt Decision Tree for water stress to capture non-linear branching.

Model Training

Overview

This report describes the training methodology, selection criteria, and operational processes for classification models trained on processed agricultural data (DAS, spectral statistics, plot IDs).

Model Training Strategy and Methodology

  • Group-based splitting (GroupShuffleSplit): group by Plot ID to prevent memorization when the same plot appears across dates.
  • Algorithm selection emphasizes suitability for limited data and agricultural logic over pure mathematical accuracy.
  • Standardization and labeling: normalize inputs via StandardScaler; encode targets via Label Encoding.

Key idea

Evaluate generalization on plots the model has never seen before by preventing Plot ID leakage across train/test.

Selected Models and Rationale

Nitrogen Prediction

Gaussian Naive Bayes — 65.5% accuracy

Selected for stability with limited observations and strong correlation between NDVI/spectral indices and nitrogen, reducing overfitting risk.

Irrigation Prediction

Decision Tree — 49.1% accuracy

Selected to capture non-linear threshold-driven effects of irrigation on plant morphology.

Model Management

  • Object persistence: serialize trained models, scalers, and label encoders to .pkl for reuse without retraining.
  • Inference pipeline: accept raw XML data and flight dates; apply identical scaling/encoding steps used in training.

General Evaluation and Constraints

The main bottleneck is volumetric scarcity of the dataset; irrigation accuracy is constrained by insufficient diversity for generalization.

Conclusion

Infrastructure is logically validated; higher accuracy is expected through retraining as data volume increases, without structural code changes.

Second Data Collection

Model Update and Accuracy Analysis After the Second Data Collection

The Second Data Collection

The second data collection covers the 2026 wheat season in the same 54-plot trial field in Adana, run by Çukurova University. The trial design is identical to the first season: three nitrogen levels (0, 10 and 20 g/m²) and three irrigation levels (0%, 50% and 100%), each of the nine combinations applied to six plots, in two sowing blocks (early sowing on 26 December 2025, late sowing on 9 March 2026).

The field was flown seven times between 24 February and 30 June 2026 with a DJI Mavic 3M multispectral drone at 50 m altitude. The images were processed into NDVI maps and delivered as per-plot zonal statistics, one table per flight.

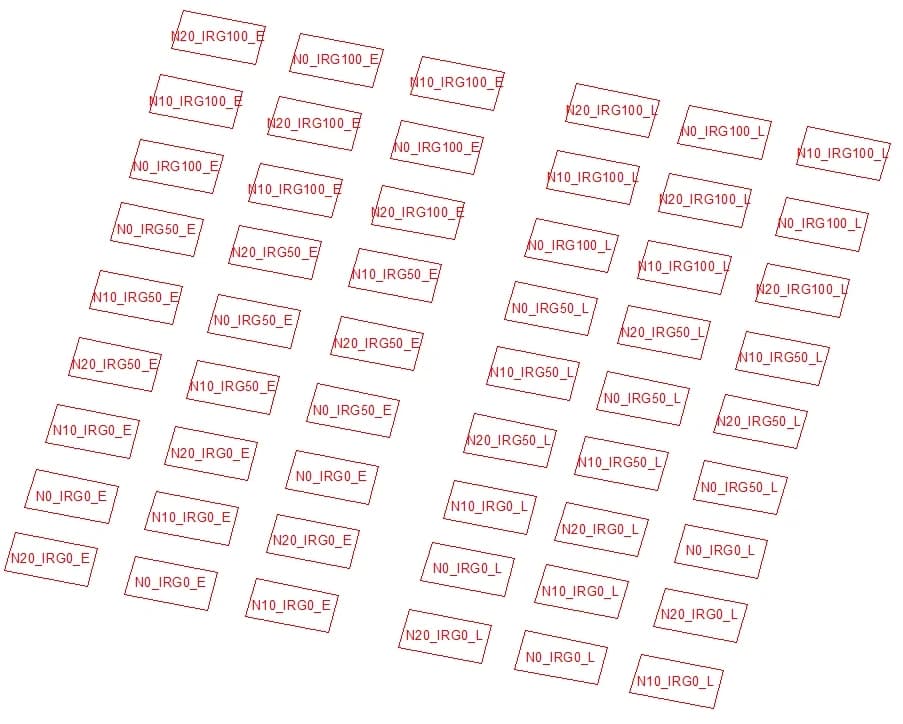
Map of the 54 plots, each labelled with its treatment, for example N20_IRG100_E: 20 g/m² nitrogen, 100% irrigation, early sowing.
The trial design from Çukurova's data archive: every plot labelled with its nitrogen level (N0, N10, N20), irrigation level (IRG0, IRG50, IRG100) and block (E early, L late). Irrigation runs in bands across each block; nitrogen varies within each band.
  • 2025 season: 5 flights (15 April – 16 June 2025), 270 plot measurements.
  • 2026 season: 7 flights (24 February – 30 June 2026), 324 plot measurements.
  • Total: 594 plot measurements from 54 plots over two seasons.

How We Worked

The two seasons were prepared as one consistent dataset, the best model was selected for nitrogen and for irrigation, and the result was analysed. All steps are reproducible Python notebooks; every number is computed from the data.

  • Same measurement method for both seasons: only statistics available in both years were used (mean, maximum, minimum, standard deviation and range of NDVI per plot, plus days after sowing).
  • Label check: 10 late-block plots in the 2026 label table contradicted their plot code; the plot code was used, as it matches the 2025 design and the field map.
  • Invalid measurements removed: two 2026 flights took place before the late block was sown, so those 54 measurements showed bare soil, not wheat.
  • Same use as in the field: the model predicts a plot's levels from a single flight plus days after sowing, exactly as the software uses it.
  • Fair testing: all measurements of a plot stay together in training or testing; 5 plot groups, repeated 3 times, give 15 test rounds. Random guessing scores 33%.

Models Tested and Selected

Twelve classification models covering all common families were tested: Logistic Regression, Ridge, K-Nearest Neighbours, Naive Bayes, Support Vector Machine, Decision Tree, Random Forest, Extra Trees, AdaBoost, Gradient Boosting, XGBoost and CatBoost. All landed in a narrow band: 42–51% for nitrogen and 27–36% for irrigation. The gap between best and worst (about 9 points) is the same as the normal variation between test rounds (about ±6 points), so the choice of algorithm has little effect.

Nitrogen: XGBoost

51% accuracy · chance 33% · p = 0.01

Reliably identifies plots that received no fertilizer, but often confuses the 10 and 20 g/m² levels. A permutation test confirms the nitrogen signal is real.

Irrigation: Extra Trees

36% accuracy · p = 0.14

The highest score among the candidates, but statistically indistinguishable from chance. It is in the software for completeness; its output should not be used for irrigation decisions.

Why the models changed from Data Collection 1

The first phase chose Naive Bayes (nitrogen) and a Decision Tree (irrigation) from a single test split of 11 plots. Measured over 15 rounds, Naive Bayes reached 42% for nitrogen, among the lowest of the 12 models. The first-phase models also used the NDVI median, which the 2026 tables do not include, so a new selection was needed in any case.

Why Accuracy Did Not Increase

The first report gave 65.5% for nitrogen and 49.1% for irrigation, from a single test split. Repeating that procedure over 200 random splits averaged 44% for nitrogen, and the first-phase models applied unchanged to the 2026 data reached 47% and 36%. The new figures are not a decline; they are a more reliable measurement of the same limit, which lies in what NDVI can show in this trial.

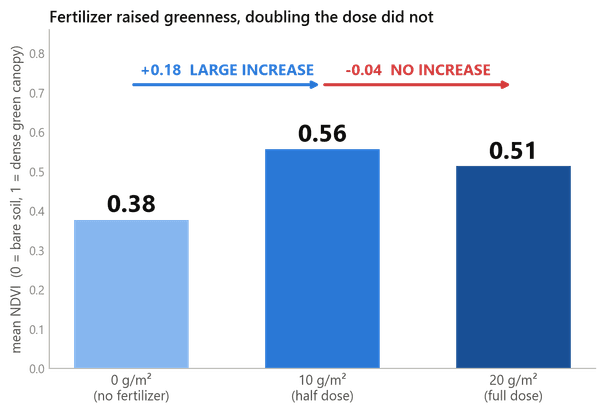
Bar chart: mean NDVI 0.38 at 0 g/m², 0.56 at 10 g/m², 0.51 at 20 g/m² nitrogen.
Figure 1. Mean NDVI by nitrogen level (all 594 measurements, both seasons).

The half dose raised NDVI clearly (0.38 to 0.56); the full dose did not raise it further (0.51). Unfertilized plots can be told apart (80% in a two-class test against 67% for always guessing "fertilized"), but the half and full dose cannot (49%, a coin flip). The practical ceiling for nitrogen is therefore about 67%, and the selected model covers about half the distance from chance to that ceiling.

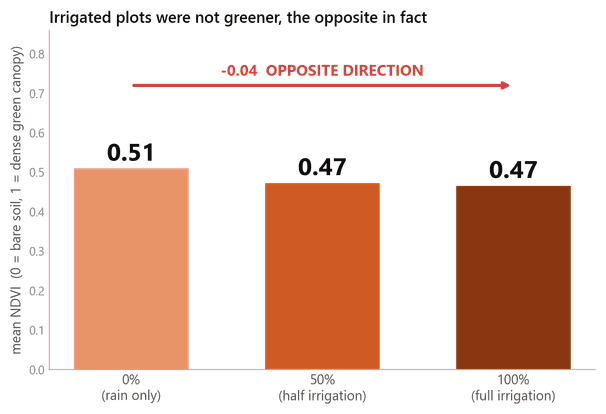
Bar chart: mean NDVI is almost the same at 0%, 50% and 100% irrigation.
Figure 2. Mean NDVI by irrigation level (all 594 measurements, both seasons).

The three irrigation levels have almost the same mean NDVI, and plots without irrigation were even slightly greener (0.51) than fully irrigated plots (0.47). Each irrigation level occupies one continuous strip of the field, so irrigation level and position in the field are the same variable (Spearman ρ = 0.94; for nitrogen ρ = 0.01): no model can tell water from location.

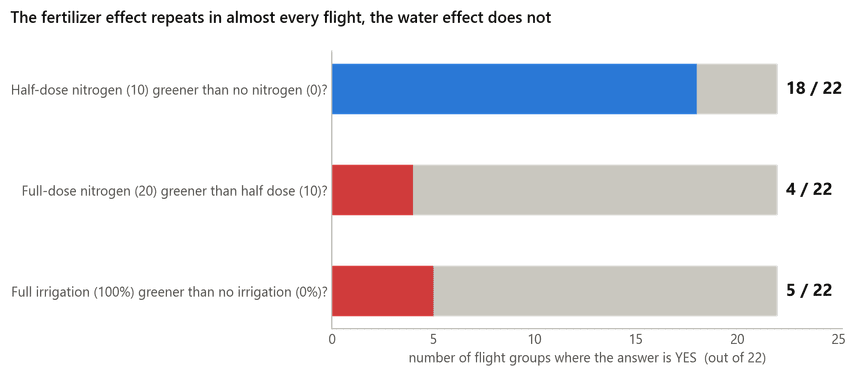
Chart: in how many of 22 flight groups each NDVI comparison holds.
Figure 3. Number of flight groups in which each comparison holds (12 flights × 2 sowing blocks = 22 groups).

Checked flight by flight, the half dose was greener than no fertilizer in 18 of 22 groups, so the nitrogen effect is consistent. The full dose was greener than the half dose in only 4 of 22, and fully irrigated plots were greener than non-irrigated ones in only 5 of 22.

Weather: Had It Already Rained Enough?

Daily weather for the field (ERA5 reanalysis, Open-Meteo archive) was compared with the crop's water demand (reference evapotranspiration, ET₀). Irrigation dates and amounts were not available, so this uses weather data only.

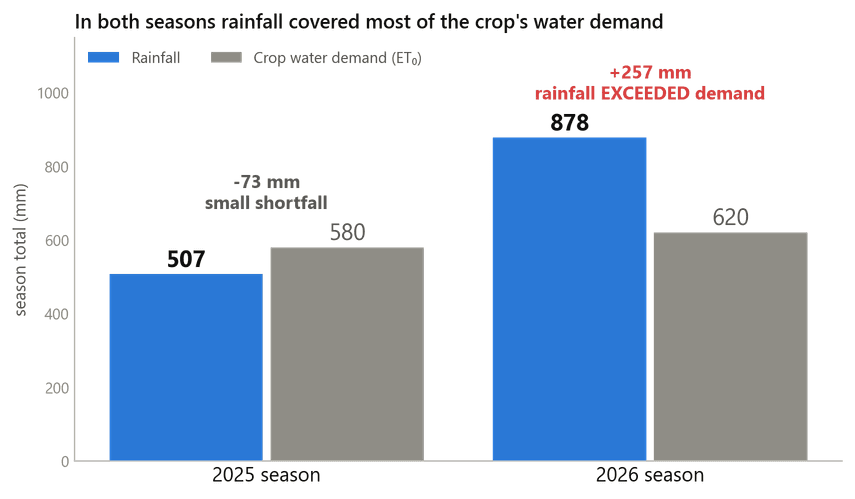
Bar chart: 2025 rainfall 507 mm against 580 mm demand; 2026 rainfall 878 mm against 620 mm demand.
Figure 4. Total rainfall and crop water demand (ET₀) from early sowing to the last flight of each season.
  • 2025: 507 mm of rain against a demand of 580 mm; rain covered about 87% of the demand.
  • 2026: 878 mm of rain against 620 mm; rain exceeded the demand by 257 mm, so even never-irrigated plots received more water than needed.
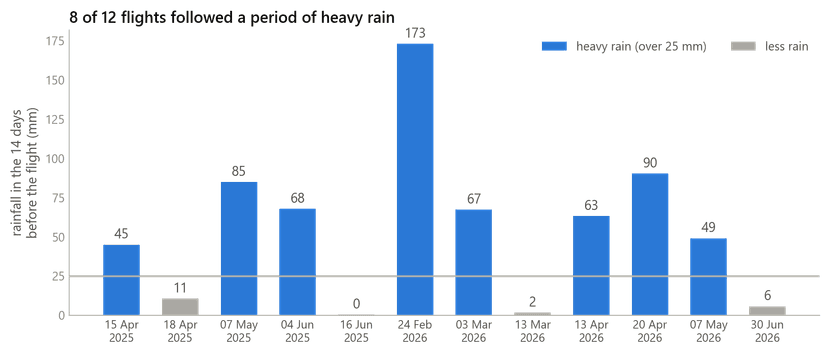
Chart: rainfall in the 14 days before each of the 12 drone flights.
Figure 5. Rainfall in the 14 days before each drone flight.

8 of the 12 flights followed more than 25 mm of rain in the previous two weeks (55 mm on average), so most measurements were taken when the whole field had recently been wetted, whatever its irrigation level.

General Evaluation

  • Nitrogen: drone NDVI carries a real, repeatable nitrogen signal. The model reliably detects unfertilized plots but cannot separate the half and full dose. Its 51% is well above chance (33%) and about halfway to the practical ceiling (about 67%).
  • Irrigation: the data contains no usable irrigation signal. Irrigation levels coincide with field position, and rain covered most of the water demand in both seasons. This is a limit of the trial layout and the weather, not of the model.
  • More of the same data or another algorithm is unlikely to help: all 12 models perform alike, and growing the training set from 24 to 43 plots improved nitrogen accuracy by only 2.7 points.

Possible improvements

Expressing each plot's NDVI relative to the other plots of the same flight raised nitrogen accuracy from 49% to 56% in tests; it is not part of the delivered model. For future trials: spread the irrigation levels across the field instead of in strips, record irrigation dates and amounts, measure soil moisture, and test spectral bands beyond NDVI such as red edge.